This section provides information about how Tealeaf on-premises works. If your role involves installing, upgrading, configuring, administering, or monitoring the system, these are some things you'll need to know.
- CX Passive Capture Application
- Tealeaf Server environment, which includes:
- Processing server
- Storage server, which includes
- Reporting component
- Archiving component
- Tealeaf user clients, which can include:
- Tealeaf Portal
- Tealeaf CX RealiTea Viewer
A stand-alone application that can be deployed to Tealeaf users.
Depending on the topology of your installation, these components can coexist on the same server or reside on separate servers.
The following illustration is an example of a Tealeaf solution. It shows the Tealeaf CX platform and its components stored on two servers and the Tealeaf products available to users.
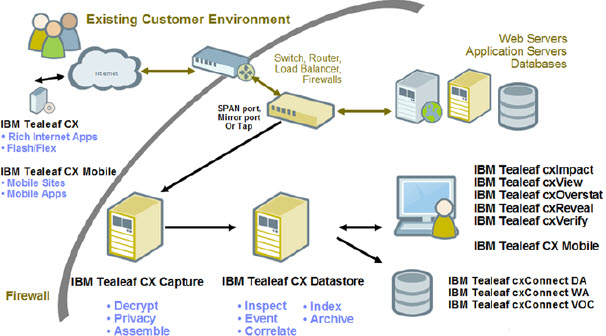
Tealeaf CX component architecture
Tealeaf solutions are distributed into three core components.
Passive Capture component
- HTTP headers
- URLs
- URL form fields (both get and post)
- URL Referrers
- user login names
- cookies
- server host names
- application
- client IPs
- page sizes,
- The HTML source code of the page returned to the customer and other diagnostics included in the HTTP(S) interaction between the customer's web browser and the web application.
The network sniffer provides a non-intrusive, real-time method of capturing what each customer is doing and seeing across the entire session with your web application. It does not introduce any overhead, latency, and risk of disrupting traffic to the application.
The capture process records the total round trip, Internet delivery, and page generation times for each page requested in the session, page cancellations, and the connection-type experienced by the customer (such as T1 or DSL) as measured by the page delivery rate.
The PCA server streams captured data to the Tealeaf CX Server environment where it is received by Transport component of the Processing Server.
For additional security, Tealeaf supports encrypting this data transport.
Tealeaf server environment
The Tealeaf server is a highly scalable, real-time, distributed platform that processes, analyzes, indexes and archives the recorded data. The Tealeaf server also serves as the platform for the Portal and RTV clients and the Tealeaf family of products.
Typically deployed behind the DMZ in a trusted network segment, the Tealeaf server environment operates on the Windows Server or Advanced Server platform.
- Processing server component
- Storage server component
The Processing server is a real-time data processing environment that receives streamed captured hits (data) from the Passive Capture Application server. The data is received through the Transport component of the Processing server. The Transport component reads the data into the Tealeaf pipeline, which consists of a series of agents that perform specific filtering and manipulation functions against the data stream to normalize and secure the data.
- Streaming the data into the Short Term Canister, an in-memory database.
- The Short Term Canister organizes by session the sequence of hits into the order experienced by the visitor.
- The Short Term Canister inspects, aggregates, and evaluates the hit data.
Data inspection is conducted by the event engine, which analyzes the captured data in real-time against a set of user-defined rules to provide insight into business process health, customer activity, application errors, page errors, and response time problems.
- Events can be defined against the occurrence or absence of a single value, text pattern, page attribute, session attribute, or compound conditions appearing in a page or across the entire session.
- Observed events are used for real-time alerting, reporting, and searching.
- Alerting functions are processed by an alerting service, which evaluates event counts against user-defined thresholds and alerting actions.
- Aggregate event counts are populated by a data collector service into the Report Server reporting database on the Storage Server.
- Event markers are also embedded into the sessions to enable indexing and session retrieval.
- Data Removal (for example, removing hits from an unwanted source as keep-alive hits)
- Data Queuing
- Data Inflation (for example, inflating hits with compressed responses)
- Privacy
- Normalization of some fields (for example, application, hostname, path, server, browser. OS)
- Routing
The Processing server component also indexes completed sessions to enable retrieval using both free-text and parametric search. The recorded HTML session data and associated indexes to the sessions are written to local disk in an embedded flat-file database referred to as the Long Term Canister.
The Storage server includes the Reporting and Archiving components.
The Archiving component provides a data storage environment for long-term storage of collected data. The archiving function lets you archive data for extended periods of time for problem resolution customer behavior analysis, dispute resolution, and other web archiving needs. Acoustic Tealeaf CX intelligently determines which sessions are of interest and should be archived based on user-defined data management rules. For example, you can archive customer sessions that include a certain class of errors or business events, a random sampling, or 100 percent of sessions captured. Sessions not marked for archiving are discarded.
By providing a distributed, dedicated storage environment with minimal disk activity, the Storage Server improves overall search response time and provides the ability to conduct data backup without taking real-time processing off-line.
The archiving component copies and maintains saved sessions and their associated indexes. At the end of each operational day, it copies the saved sessions and indexes to specified drive locations on the Storage Server.
Upon expiration, sessions and indexes can either be automatically deleted or saved off to cold storage.
The Reporting component of the storage server consists of Report Data Collector services, which collect the Processing component aggregated values and populate the reporting database, and the Portal Web Application, the user interface.
Normally, the Archiving and Reporting sub-components are kept together but for optimum efficiency they may be placed on separate machines for high-volume sites.
User clients
The Tealeaf cxImpact solution includes two user clients:
- Portal
- RTV
The Portal is a real-time, web-based console that provides a centralized workspace for the production support team to identify, size and diagnose issues impacting business-critical web applications, as well as a tool for administrators to manage the overall health of Tealeaf solutions.
It offers a real-time view of user activity, searching capabilities and reporting functionality to provide rapid awareness and problem resolution.
The RTV is a win32 client used by the production support team and other users of Tealeaf solutions to recreate problems or other issues by visually replaying the real user's interaction with the web application. The user session is replayed step-by-step, as it was recorded at the time the real end-user conducted the session. In addition, the RTV also provides advanced search and correlation functionality for advanced causal factor isolation and problem diagnosis.
The Portal web application is served from the Tealeaf Server. The Portal can be served from over HTTP (port 80) or HTTPS (port 443). End-user access to the Portal is controlled via its native authentication system or by using Windows NT Authentication to administer groups and users on the Tealeaf Server machine. Database access via the RTV can also be controlled using Windows NT Authentication (see Access controls using Windows Domain Authentication). In addition, data query, end-user and administrative actions conducted via the Portal and Viewer clients is logged to enable auditing of which end-user requested and accessed what data (see Access and change auditing).
User interfaces
Tealeaf on-premises provides three user interfaces: Tealeaf Portal, CX RealiTea Viewer (RTV), and PCA Web Console. Each user interface provides access to different Tealeaf functions.
| Tealeaf user interface | Description |
|---|---|
| Tealeaf Portal | The Tealeaf Portal is a web application that is the most common point of access for Tealeaf users. You can use the Portal to search for and replay sessions, manage events and reports, and monitor user and site activities. |
| CX RealiTea Viewer (RTV) | RTV is a Windows™-based application that can be installed on your desktop computer. You can use RTV for searching and replaying sessions. |
| PCA Web Console | Tealeaf CX Passive Capture Application (PCA) administrators can use the PCA Web Console to monitor PCA performance and apply configuration changes. Administrators must use a separate URL and authentication mechanism to access PCA Web console.
Note: If you are not a Linux™ administrator responsible for managing the Tealeaf CX Passive Capture Application, you might not require access to the PCA Web Console.
|
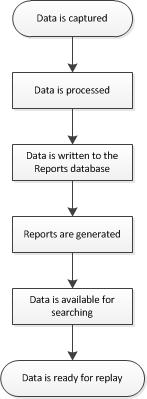
Tealeaf process flow diagrams
The following diagrams explain the Tealeaf process flow.
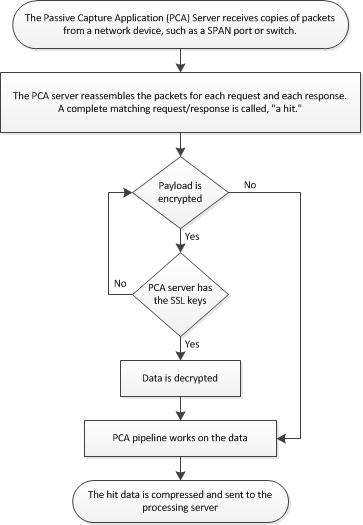
CX Passive Capture Application process flow diagram
Capturing data is the first step in the Tealeaf process flow. Tealeaf CX Passive Capture Application (CX PCA) captures data from your website or mobile application.
The following diagram explains the CX PCA process flow:
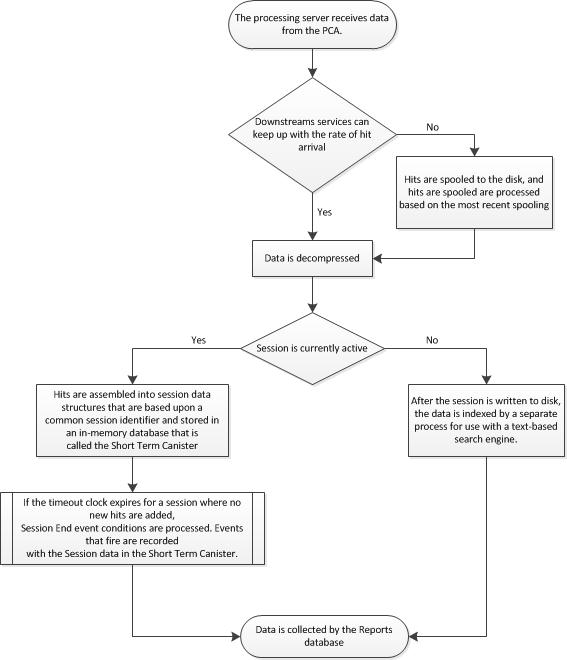
Processing server flow diagram
After the data is captured by CX PCA, it is sent to the processing server, which is also known as Canister.
Data can be processed by one of the following servers:
- Single processing server
- Multiple processing servers
- Multiple processing servers and an HBR server to manage distribution to the processing servers based on their current load
The following diagram explains the processing server flow in brief:
The Canister consists of two databases designed for the capture, evaluation, and storage of session data.
The following points are applicable for the Short Term Canister:
- Short Term Canister: This in-memory database is used to store hits forwarded to the Canister from the Transport Service or Health-Based Routing session agent. For each session, each hit is added to the STC, associated with the other hits of the session, and evaluated for events. When the session is closed, it is moved to the Long-Term Canister.
- Long-Term Canister: When a session is closed, it is written to a disk-based database called the Long-Term Canister. These disk-stored sessions are then indexed for search.
The canister processor consists of manager process TlCanMgr.exe. This process manages four types of worker processors:
- TLEventProc.exe evaluates hits for events.
- TLSesnCloser.exe evaluates expired sessions for session-level events.
- TLSesnArchiver.exe prepares and stores sessions.
- TLEventBus.exe processes events placed in the event bus queue.
Note: To stop and restart the Canister Manager, use the Start menu shortcuts under the Portal heading. The Start menu shortcut runs CanSvcs.exe, which manages the flow of hits into the canister and spooling operations. Using the Windows Services Control Panel to stop and start the Canister Manager might cause data loss.
Note: Use of UNC paths is supported in configuring Canisters. For the Processing Server (Canister), you must install locally and then insert the UNC paths into the Canister configuration after the installation has completed.
- For each session, a timeout clock is reset with each new hit.
- Text in the hit is parsed for the occurrence of hit attributes and session attributes that are used for event evaluation.
- The hit-level event conditions are processed, and events that fire are recorded with the Session data in the STC.
- If the timeout clock expires for a session where no new hits are added, the Session is written to the Long Term Canister, where completed sessions are stored for a predefined number of days.
- In the Long Term Canister, the event counts are aggregated into 1-minute buckets.
Overview of Tealeaf servers
Several servers are required in a Tealeaf system.
| Server | Description | Services Panel | Portal Management | TMS |
|---|---|---|---|---|
| Canister | Capture and storage of active and completed sessions; indexing of completed sessions for search. Also known as the Processing Server, which is functionally equivalent to the ctree database. | Tealeaf Canister server | Canister Server
When a Canister server reference is created in the Portal Management, a reference to the Search Server on the Canister is automatically created, too. |
Canister server |
| cxConnect | Manages extraction of session data for delivery to third-party systems | N/A | Tealeaf cxConnect for Data Analysis Server | Tealeaf cxConnect for Data Analysis Server |
| cxReveal | Receives session attribute information from the Canister via Event Bus for insertion into the Tealeaf cxReveal Search database. | N/A | Tealeaf cxReveal Database Search Server | Separate server |
| Data Service | Manages communications between Tealeaf components and the databases. | Tealeaf Data Service | Data Service Server | Data Service |
| PCA | Portal definition for the machine hosting the Tealeaf CX Passive Capture Application | N/A | Capture Application Server | PCA Server |
| Replay | Manages the replay of sessions through the Portal (BBR). | Tealeaf Replay Server | Replay Server | Replay Server |
| Report | Manages queries to other servers in the Tealeaf environment. | N/A | Report server
When a reference to the Report Server is created in the Portal Management page, a reference to the Search Server instance on the server is also created. |
N/A |
| Search | Manages searches of active and completed session data, among other functions. | Tealeaf Search Server | N/A | Search Server |
| SQL | Microsoft™ SQL Server product is required host of Tealeaf databases. | MSSQLSERVER | N/A | N/A |
| Tealeaf Management | Manages TMS. | Tealeaf Management | N/A | Tealeaf Management |
| Transport | Additional instances of the Transport Service can be deployed as Health-Based Routing (HBR) devices. | Tealeaf Transport Service | N/A | Transport Service |
Tealeaf services
| Service | Description | Services Panel | Portal Management | TMS |
|---|---|---|---|---|
| Alert | Manages execution and delivery of event-based alerts. | Tealeaf Alert Service | N/A | Alert Service |
| Canister | Controls and monitors the canister and Tealeaf Canister Server processes. Canister Services are restarted by the Canister Manager when an error condition is detected. | Tealeaf Canister Manager | N/A | Canister |
| Data Collector | Queries Tealeaf Canisters and aggregates data for storage into the Tealeaf databases. | Tealeaf Data Collector | N/A | Data Collector |
| Data Service | Connection manages between Tealeaf services and the databases they query. | Tealeaf Data Service | N/A | N/A |
| Extract Service | Used by Tealeaf cxConnect for Data Analysis to extract session data from Tealeaf databases. | Tealeaf Extractor Service | N/A | Extractor Service |
| Portal GUI | Stops, starts, and restarts Microsoft IIS, which hosts the Portal application. | N/A | N/A | Portal GUI |
| Query Server | Manages communication between the Portal and the Visitor database. Embedded in the RSE Service. | N/A | N/A | N/A |
| RSE Service | Analyzes session data to create segments. | N/A | N/A | RSE Extractor Service |
| Session Indexer | Indexes completed sessions stored in the Canister on the same Processing Server. | Tealeaf Session Indexer | N/A | Session Indexer |
| Scheduling Service | Manages schedule and execution of Tealeaf jobs including backups, extractions, and Portal Status reporting. | Tealeaf Scheduling Service | N/A | Scheduling Service |
| Tealeaf Status | Provides status information on configured Tealeaf components and services. | N/A | N/A | N/A |
| Tracking Service | When enabled, the Tracking Service supports Replay Server logging in BBR so that logging information displays in the Processing window when sessions are loaded.
Users with Administrative authorization can expand the Processing window to get a real-time view of the logs from the rendering engine. |
Tealeaf Tracking Service | Replay Server | Tracking Service |
| Transport Service | Receives session data from the PCA Server and initiates and manages Windows pipeline operations.
If you are using a 64-bit pipeline component for the HBR server, you need to deregister the default 32-bit Transport service and register the 64-bit Transport service. |
Tealeaf Transport Service | Transport Service | Transport Service |
| Service Name | Description |
|---|---|
|
Tealeaf Management Server (TLMgmtsrv.exe) |
Provides management for Tealeaf components for that machine. |
|
Tealeaf Search Server (TLSrchsrv.exe) |
Provides session search capabilities through a TCP/IP network. |
| Service Name | Description |
|---|---|
|
Tealeaf Replay Server (TLReplaySrv.exe) |
Generates session data for replay within the Portal. |