After a product recommendations strategy is live, you can its performance by monitoring the number of views and clicks that are received on the recommendations for that zone over a time period.
To view the performance details:
- Log in to Acoustic Personalization. Go to Zones page and select the channel.
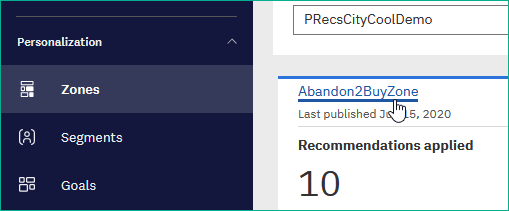
- Click the title of the zone for which you want to view the performance details.
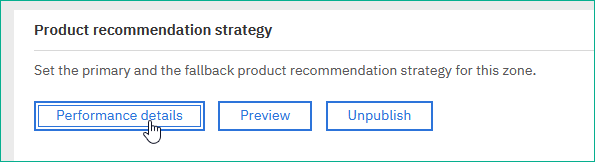
- Click Performance details.
The progress of your product recommendation strategy is shown by following metrics:
|
Metric |
Description |
Calculation |
|
Total Views |
The number of times the recommended products on the zone were shown across visitors. |
For example, if two products are displayed on a zone, and the zone is shown to a visitor thrice, then the total views for that zone would be 6. |
|
Aggregate clicks |
The total number of clicks the recommended products of the zones across visitors. |
For example, if a visitor clicks two recommended products on the zone and another visitor clicks three products on the same zone, the aggregate clicks would be 5. |
|
Number of recommended products added to the cart |
The total number of recommended items that are added to the shopping cart. |
For example, if a visitor adds five recommended products to the cart, the total would be 5. |
|
Click rate |
Click rate is calculated as the total number of clicks of the recommended product as a percentage of the number of products recommended. |
Calculation: Click rate = (Aggregate clicks / Total views) x 100 |
|
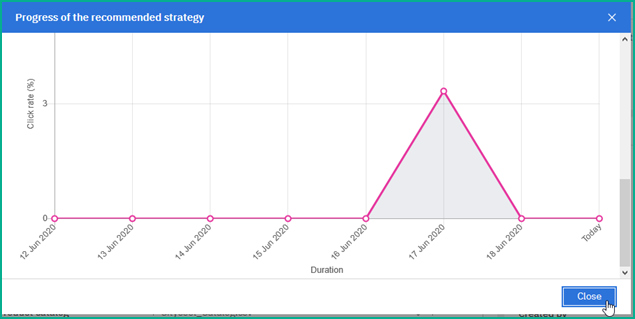
Table 1. Progress of the strategy |
||
Apart from the text values, the progress is also shown visually in the form of a line graph.