Performance reports are only shown if the rule has a Primary goal (and optionally, one or more secondary goals) associated with it. If you click the New Performance link for a rule with no goals, a message informs that the rule has no goals associated with it.
If you're creating an A/B test and do not associate a Primary goal with it, you will not receive any performance data or statistical significance information.
Impact of editing a goal on performance reports
If you want to edit a goal that is currently being used in active rules, you have two options:
- You can choose to edit the original goal. In this case, the performance report for the goal after the edit date will be based on the new definition of the goal. When you view performance report for a rule that has an edited goal associated to it, the original goal is displayed in the Legacy goal tab and the new (edited) goal is shown in the Goals tab.
- You can choose to create a copy of the rule and then edit the copy (duplicate) rule as needed. In this case, the edited goal will be tracked as a new goal after it is published.
If you want to edit a goal that is not being used in active rules, the performance report for the goal after the edit date will be based on the new definition of the goal.
Impact of deleting a goal from Goal Library
If you attempt to delete a goal from Goal Library, a warning message appears. The message provides details of the rules currently using the goal, with link to the rule details page for more information. Note that deleting a goal also removes all the performance report information associated with the goal.
View performance report for goals
To view performance reports for goals associated with a rule, complete the following actions:
- Log in to Acoustic Personalization and click Zones.
- In the zone that has the relevant rule, click Actions > View details. The page shows list of all the rules for that zone.
- Click the rule that has the required goals associated with it.
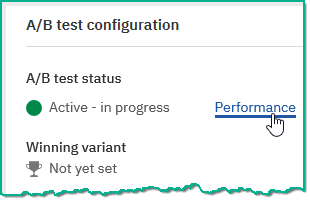
- In the Rule configuration section (or in case of A/B test, the A/B test configuration section), click Performance link.

- Performance page for the goal opens.
Understand performance reports
The performance reports provide the following information.
Rule information
This section lists the rule details such as:
For content personalization
- Current status of the rule, for example - Active
- Primary goal name
- Secondary goal name(s), if any
- Segment in which the rule is currently being used
- Control group percentage
For A/B test
- Current status of the A/B test, for example Active - In progress
- Primary metric used to measure the performance
- Statistical significance value currently achieved
Summary
This table provides numerical data for the goal performance.
For content personalization
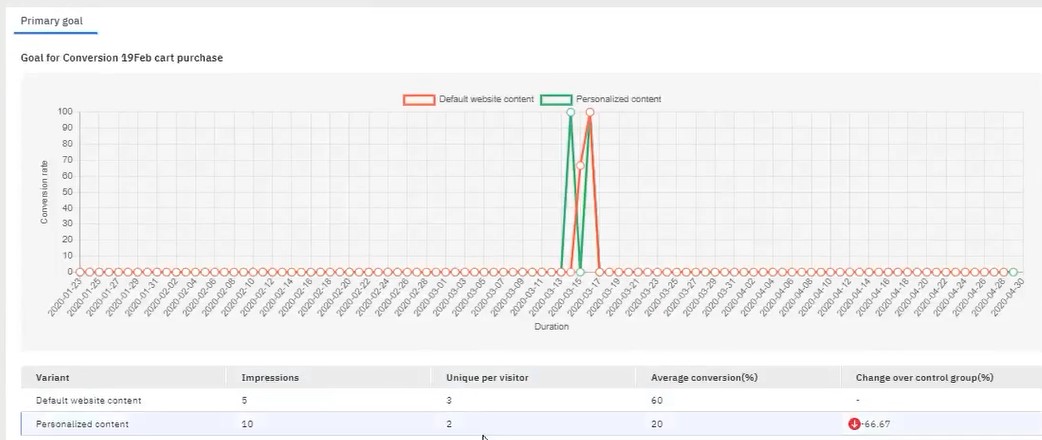
Information for default content and personalized content, with values for number of impressions, primary goal and secondary goal(s), and other parameters as specified in the goal.
For A/B test
Information for control group and variants, with values for number of impressions, number of sessions, percentage change over the control group, and other parameters as specified in the goal.
Graphs
The line graphs provide a visual representation of conversion rate versus the timeline.
For content personalization
By default, the graphs illustrate goal performance for default content as well as personalized content.

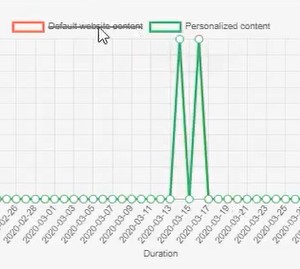
To view individual variant information, you can deselect other variants in the graph legend.
For example, to view the performance for personalized content, deselect the graph legend for default content. The graph will now show the details for only the personalized content. In the table below the graph, the row for personalized content is highlighted.

For A/B test
By default, the graphs illustrate goal performance for the control group as well as all the variants (test groups). To view individual variant information, you can deselect other variants in the graph legend.
For example, to view the performance for Test group 1, deselect the graph legend for Control group and other test group(s). The graph will now show the details only for the Test group 1. Also, in the table below the graph, the row for Test group 1 is highlighted.
